
The Art of Power Scaling: From Shonen Battles to the NBA Hardwood
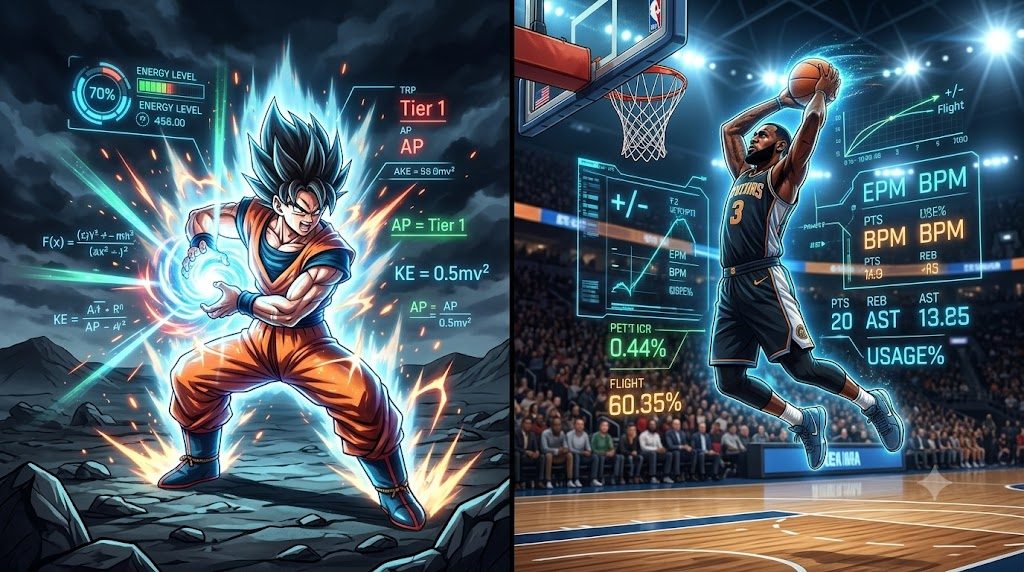
Ranking Gods and Monsters
People love ranking things. The urge to build an objective hierarchy out of subjective art is everywhere, and it’s especially strong in internet battleboarding. A decade ago, forum arguments about whether a comic book hero could beat an anime protagonist mostly came down to gut feeling and favoritism. Today, some of these debates read more like physics homework.
Calculation groups on the VS Battles Wiki don’t just argue. They use standard physics formulas, such as kinetic energy (KE = ½mv²), to estimate how many joules it would take to shatter a fictional moon. The community works like a peer-review system, with tens of thousands of indexed characters ranked on a strict tiering scale. That scale starts with zero-dimensional concepts and climbs through energy thresholds. Around 1.046 × 10¹⁷ joules, or 25 megatons of TNT, marks the top of the City level tier. Past roughly 4.184 × 10¹⁷ joules (100 megatons), a feat counts as Mountain level. At the very top sit “Tier 0: Boundless” characters who exist beyond space and dimensions altogether.
Pixels, Punches and Attack Potency
The amount of work behind these rankings is surprising. When an animation studio draws a planet exploding, the artists just want the scene to look spectacular. Analysts treat it as evidence. Using a technique called pixel scaling, they find a known reference point in the frame. If a character is officially 1.7 meters tall, someone will measure how many pixels tall they are on screen and use that ratio to estimate the size of a crater in the background.
The problem is that animation is rarely drawn to scale, and the community learned this the hard way. A calculation based on a character’s 2.3-centimeter eyeball can, because of pixel distortion, make that character look nine feet tall, which throws off every volume and mass estimate that follows. Calculation groups now have strict rules about which reference points are acceptable.
That problem led to one of the community’s core ideas: Attack Potency (AP). Fiction is full of characters who survive nuclear-level attacks but only knock down a few walls when they hit back. Attack Potency closes that gap. If a martial artist manages to hurt a villain with known “City level durability,” the martial artist is credited with City level Attack Potency, no matter how little damage the surroundings show. Without this kind of transitive logic, a story’s power system stops making sense.
Cosmology and Plot-Induced Stupidity
The internet’s most heated matchup, Goku from Dragon Ball versus Saitama from One-Punch Man, shows how far this goes. Saitama destroys star systems on screen, so his visible destructive capacity is enormous. His fans argue that his whole premise is limitless growth, so he’ll always scale up to beat anyone.
Strict battleboarders reject that argument. Their rules ban the “No Limits Fallacy”: you can’t assume a character has infinite power just because the author hasn’t shown their limit. Goku, meanwhile, operates on a much larger cosmic scale. In some of his fights, the shockwaves threaten the entire macrocosm of Universe 7, which includes multiple dimensions and void spaces. On that basis, calculation groups give Goku a multiversal tier.
It gets even more complicated once video game versions enter the picture. Non-canon characters like Xeno Goku are credited with abilities such as time manipulation and “immeasurable speed,” which put them outside normal time altogether. Then there are the moments when Goku gets hurt by a laser or a stray bullet. Calculators dismiss these scenes as “Plot-Induced Stupidity,” inconsistencies that would otherwise break the baseline numbers.
Sports Betting Speaks the Same Language
Sports fans like to tease anime fans, but open the DraftKings app and you’ll see the betting market thinking in a very similar way. Professional bettors ignore media narratives, talk of clutch genes and general hype. They care about statistical thresholds. When a sportsbook sets a points line for Shai Gilgeous-Alexander at 30.5, it’s essentially setting his power level for the night.
Bettors respond by power scaling the players. Some write Python scripts to collect odds and stats, then spend hours studying NBA player prop lines against large samples of game data to look for mispriced numbers. A sharp bettor who sees LeBron James at +118 to score 20 points will check his usage rate over a specific 28-day window before deciding. They set aside the jersey and the legacy and look only at what the recent numbers say.
The markets go well beyond basic stats. Bettors weigh combination props (points plus rebounds plus assists) and head-to-head matchups. Deciding whether Cade Cunningham will outscore Jayson Tatum in a single game uses the same reasoning as debating whether Naruto can outrun Ichigo.
From Box Scores to EPM
The traditional box score can’t handle this level of analysis. Counting stats reward players who take a lot of shots and miss the value of strong defenders and floor spacers. Hockey tried to solve this long ago with plus-minus, which tracks the score difference while a player is on the ice. Basketball adopted it too, but raw plus-minus is very noisy. Put a weak bench player on the floor alongside a superstar, and his plus-minus can look excellent simply because of who he plays with. Statisticians call this collinearity.
Analysts needed a way to isolate each player’s own contribution. In the early 2000s, Mark Cuban’s Dallas Mavericks worked with statisticians Wayne Winston and Jeff Sagarin on an early version of adjusted plus-minus (APM). The method runs a large regression across every stretch of play in which the same ten players are on the court. The outcome being predicted is the scoring margin per 100 possessions, and each player is a separate variable, which separates his impact from that of the other nine players on the floor. In theory it worked well. In practice, small samples produced very noisy results.
Box Plus/Minus (BPM), developed by Daniel Myers, helped fix that. Myers fitted box-score stats to regularized adjusted plus-minus (RAPM) data, which gave different actions different weights depending on position. A defensive rebound from a center is worth something different from the same rebound grabbed by a small point guard. Point guards rack up many lower-value assists, while a center’s assists are rarer and often reflect strong reads of the game. The latest step is Estimated Plus-Minus (EPM), created by Taylor Snarr, which adds player tracking data, age curves and prior seasons to filter out random noise. For many analysts, EPM has become the go-to ranking system for NBA players, and it has made the old “eye test” far less persuasive.
Two Communities, One Instinct
The parallels between the two worlds are hard to miss. Sports analysts use regression to discount a 30% three-point shooter who gets unusually hot for five games. Anime calculation groups throw out panels where a god-tier hero loses a fistfight to an ordinary person. Fans in both communities want firm answers from unpredictable systems.
Analysts who adjust a slow-paced 1990s basketball game to a standard 100 possessions are doing much the same thing as a forum user normalizing different comic book universes. Both strip out the noise, fix the variables and run the comparison. People don’t like leaving things unexplained. Give a dedicated fan enough data, and they’ll try to rank anything, gods included.